October 7, Hantsport to the famous Grape Stomp
First let me cast a bit of perspective on the elevation profiles I'm posting. The object is definitely not to scare off any riders; rather it's to allow you to realize what the ride that you accomplished was like, which should allow you to try more daunting rides with more confidence. Well, that's the theory anyways.
Also note that not all sets or graphs within a set are necessarily to the same scale. And in all cases the vertical scale is exagerated. If you have a really wide computer screen you could open a graph with a graphics program and stretch the distance scale so that 1 km was the same size on the screen as 1000 metres on the vertical scale and that would show the real slope of the road...
And now on with the show....
___________________________
The profiles for this ride are a bit scatterbrained, because I rode out from home and didn't meet up with the group until after everyone else had climbed the first hill out of Hantsport. I also turned right at Highway 1 on the return trip, in order to get home before sunset and so missed the ride to and through Mt Denson. But I had ridden both those roads earlier in the summer, and have extracted those parts of the trips for this weblog. Scales are a bit different than for the main part of the trip.
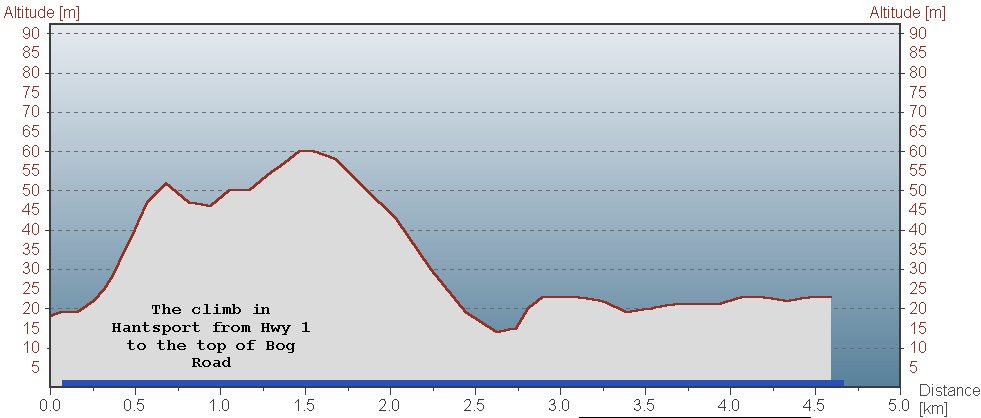
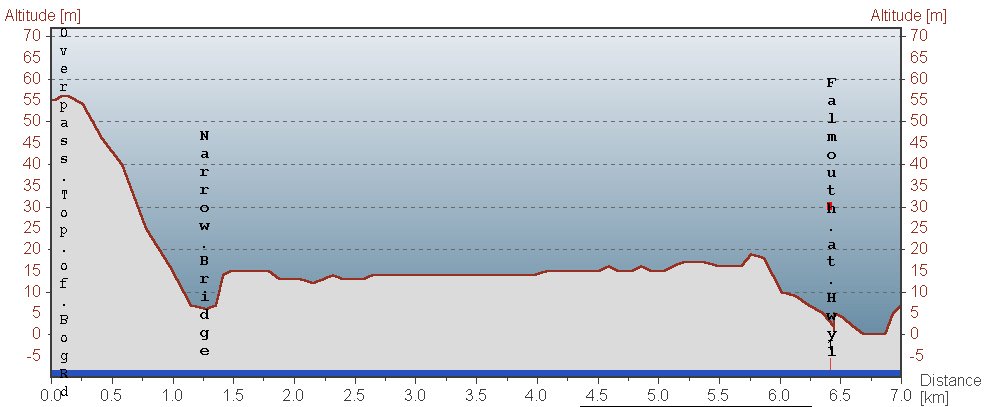
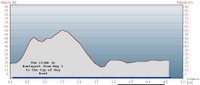 So, first the climb up from Hantsport. The section after km 1.5 (the very top of the climb) overlaps with the next section.
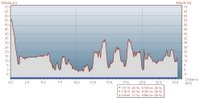
Here, the whole of the ride that I attended. Have a look at the little table below the graph; it shows the % of the ride spent climbing, descending, or on level-ish roads. The next few graphs are expanded-scale sections of this one.
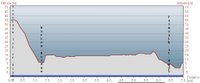
The Bog Road segment.
I'm going to have to continue this tomorrow; the software isn't letting me add any more graphs here!!!
Also note that not all sets or graphs within a set are necessarily to the same scale. And in all cases the vertical scale is exagerated. If you have a really wide computer screen you could open a graph with a graphics program and stretch the distance scale so that 1 km was the same size on the screen as 1000 metres on the vertical scale and that would show the real slope of the road...
And now on with the show....
___________________________
The profiles for this ride are a bit scatterbrained, because I rode out from home and didn't meet up with the group until after everyone else had climbed the first hill out of Hantsport. I also turned right at Highway 1 on the return trip, in order to get home before sunset and so missed the ride to and through Mt Denson. But I had ridden both those roads earlier in the summer, and have extracted those parts of the trips for this weblog. Scales are a bit different than for the main part of the trip.
 So, first the climb up from Hantsport. The section after km 1.5 (the very top of the climb) overlaps with the next section.
Here, the whole of the ride that I attended. Have a look at the little table below the graph; it shows the % of the ride spent climbing, descending, or on level-ish roads. The next few graphs are expanded-scale sections of this one.
The Bog Road segment.
I'm going to have to continue this tomorrow; the software isn't letting me add any more graphs here!!!
posted by Leo at 6:01 PM
![]()
![]()

0 Comments:
Post a Comment
<< Home